Wall Loading Tab |

|

|
Wall Loading Tab |
|
|
Wall Loading Diagram
This diagram displays the active or at-rest pressure distribution, the passive pressure distribution, any applied loads that have been defined, and the maximum soil pressure distribution.
Loads are color-coded and may be turned on and off by using the checkboxes across the top of the diagram.
To print, use button at upper left.
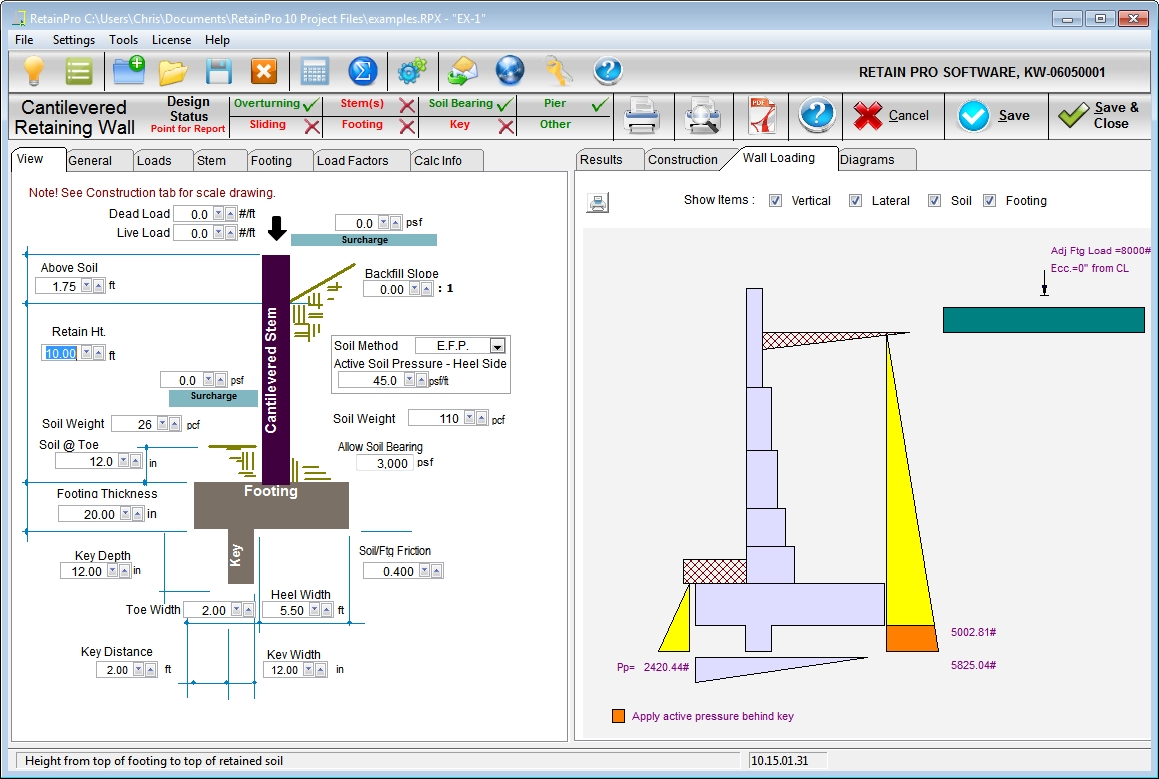
Note that if seismic or adjacent footing loads are used, the Wall Loading diagram does not graphically depict these loads, but they are included in the reaction shown at the bottom of the diagram.
This feature not available for segmental walls
This drawing will not depict the wall in a graphically correct way until sufficient data has been entered. Only a default graphic will appear initially.